
How to Enable Video Analytics
To enable Video Analytics, go to camera settings and choose the Analytics tab. Each analytic may be enabled separately and is billable per camera. A new tab will appear for each when clicking the checkbox.

Camera Settings – Enabling Analytics
To view the analytics overlay on live preview and historic video, enable “Show Analytics” under “My Profile” in the “Previews” tab.

My Profile / Previews
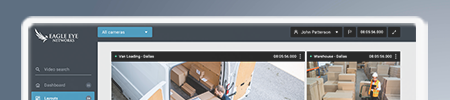
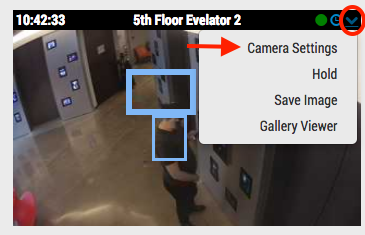
Access the analytics graphs by selecting analytics under actions of the camera when viewing preview video or from the dashboard. From the preview, click the actions button in the top right of the preview window to be presented a drop down that will include analytics.

Accessing Graphs from Preview
On the dashboard, the analytics button is displayed under actions. All cameras will show motion analytics. Each additional analytic enabled for a camera will appear in its own tab.

Example of Counting Graphs – Counting In
Viewing Analytics in the History Browser
The colors in the history browser represent the recording of full video, motion, and analytics. Dark blue indicates the full video is available. Light blue indicates motion. Light green indicates object tracking by analytics. Dark green indicates an analytic line cross or intrusion. This could be line crossing either direction or intrusion into and out of the forbidden area. For the counting analytic, an overlay of the main direction, opposite direction and difference between the two are displayed in the upper right of the preview. Navigation of the history browser shows current counting data for the day.

Example of Viewing Analytics in the History Browser / Object Counting Overlay with Counting Markers
Analytic Events
Just as motion events are recorded, so are Analytic events. When an Analytic sees an object based on the width and height settings, it is considered an event. In the history browser, Analytics Events are shown in green. The default camera settings for recording full video is based on “event.”

If the motion is turned off and an Analytic is enabled, the full video will be recorded on an Analytic event. This is an important feature as it can be used to minimize recording events that are not of interest. For example, trees waving in the wind can cause constant recording based on motion. While it is possible to use regions to adjust the sensitivity, this can also mean that some motion of interest may be missed. Using Analytics can alleviate this issue.
In this example, the analytic added to the camera is Line Crossing. The important setting is object width and height. If an object is detected that matches the size parameters anywhere on the screen an analytic event creates full video recording. In this example scene, only a car or person will create the event. The trees blowing in the wind to do not cause a recording. This can be very beneficial because it helps to quickly find the video of interest, and it also requires less bandwidth to transmit the full video to the Eagle Eye Cloud.

Learn More About Eagle Eye Analytics
Enable Analytics on your Eagle Eye Account
+1-512-473-0501
[email protected]
Other posts that might interest you
Accessing Camera Settings
With the proper permissions, camera settings can be accessed from the dashboard or from layout view. From the dashboard, click the gear icon to open the cameras settings. [caption id="attachment_12964"…
February 21, 2017
Creating Email Alerts
In part 1, we showed how to mask out a motion zone to ignore motion. In this post we are going to show how to create email alerts. We will…
September 26, 2014
Line Crossing
About Line Crossing Line Crossing is setup the same as Object Counting, but with the ability to send a notification when the line is crossed in the specified direction. The…
August 22, 2017